
Data expertise to transform reporting
The Challenge
CALA constantly analyse media, CRM and other third party consumer touchpoints at individual development level to monitor audience engagement, marketing performance and overall development health.
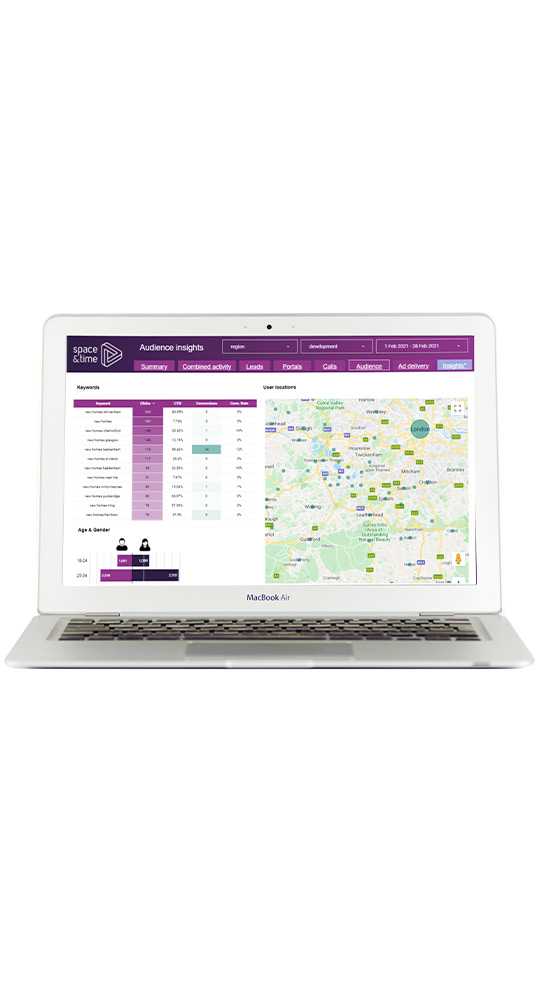
Working collaboratively, Space & Time and CALA planned a live dashboard that would enable all stakeholders to quickly navigate through key reporting dimensions and metrics from multiple data sources. An important part of the visualisation side of the project was the ability to filter to Group, Region and individual development views rapidly and give a sense of the combined impact of activity whilst being able to drill into individual channel and platform results historically as well as close to real time as possible.
Our Approach
CALA were already leveraging our Media capabilities; managing a high volume of always-on biddable campaigns (as well as providing offline and broadcast activity). That, coupled with our Performance Directors working closely on the ground with Sales and Marketing teams around England and Scotland, means we have a detailed understanding of CALA’s focuses, their audiences and a passion for constantly helping to develop on a successful marketing ecosystem.
S&T’s Client Experience teams, channel specialists and Data Analysts collaborated closely together to plan the ideal reporting solution; plotting which data elements would be required and obtaining necessary access to APIs or custom data files.
This was then followed by the integrations process from our Solutions Engineers of using ETL (Extract, Transform, Load) tools to connect data sources to our Cloud Data Warehouse, BigQuery. With raw disparate data stored and historically backfilled for the couple of years’ worth of reporting necessary for some campaign trends, a bespoke reporting layer would be built. In essence, this would be the product of cleansing and aggregating across multiple data sets to bring everything together into a single data source for use in data visualisation platforms.

Our Solution
A dashboard was designed in Data Studio connected to the BigQuery reporting layer and processes were put in place to ensure continued monitoring of data connections in the data warehouse and to identify when new developments were live on the website or property portals that required mapping into the database for surfacing in reports.
As well as delivering the planned dashboard, S&T are always keen to emphasise the importance of centralised and cleaned data within the data warehouse. The capability for CALA to use their reporting layer and the data sources behind it to approach questions and analysis – such as creating bespoke omni-channel measurements or exploring predictive models – beyond the scope of the dashboard is vastly improved. CALA also migrated to a new website 6 months after the initial build. Our site migration services (e.g. analytics audits and amendments, ensuring accurate tracking and tag management for new site engagement) – were utilised prior to the launch, but we also ensured their reporting dashboard was tested, aligned and re-modelled to the new data points.
Space & Time continue to go above and beyond providing reporting tools and dashboards which help support CALA and all our marketing efforts. Each new update or iteration of the dashboards they provide is always carefully considered to ensure we are reporting on real tangible metrics which are relevant, easy to understand and which we can take action quickly.
Serish Khera Group Transformation Manager, CALA Group